How CETIN Slovakia Uses BitSwan for Smarter Telco Operations

Matěj Outrata
Telecom operators today manage large, complex, and ever-changing systems. Even a small unnoticed issue can quickly lead to slow performance, dropped calls, or unhappy users. Cetin Networks Slovakia faced this challenge firsthand. Problems often surfaced only after users complained to customer support. This reactive approach slowed response times, made finding the root cause more difficult, and affected user experience.
To move from firefighting to foresight, they needed a smart, real-time solution that could handle large volumes of data, adjust to changing traffic patterns, and provide useful insights before users were impacted. That’s where BitSwan came in.
A Complex Network That Never Sleeps
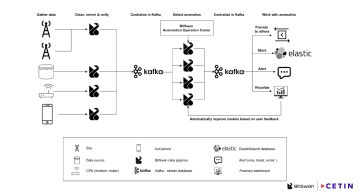
Cetin operates a complex mobile network with thousands of radio cells that use different generations of mobile technologies, including 2G, 4G, and 5G. The network includes hardware from several vendors, such as Nokia, Huawei, and Ericsson. Each layer and vendor brings different data formats and performance metrics.
Moreover, end-user devices like routers, smartphones, and modems produce their own telemetry. These sources create a constant and large flow of performance data. This data covers areas like signal quality, throughput, packet loss, latency, and device behavior.
Standard monitoring tools quickly get overwhelmed. Manual analysis is nearly impossible due to the sheer volume, variety, and speed of the data. As a result, service issues are often found too late. When a customer called, engineers had to gather scattered data sources just to figure out what went wrong, let alone fix the problem.
A Smarter, Proactive System
Cetin decided to use BitSwan to improve their monitoring strategy. This cutting edge technology offers a modern, modular platform for creating and managing real-time data pipelines using technologies like Python, Jupyter Notebooks, and advanced machine learning techniques.
Data flows into Kafka in real time. This includes metrics from the radio access network, logs from network devices, and performance statistics from connected customer equipment. BitSwan receives this raw data stream and begins its processing.
The first step is data preparation is standardizing data across formats and sources by converting everything to a structured format. Timestamps are aligned, site and cell identifiers are added, and numeric normalization is applied to ensure consistency. This process transforms raw, noisy data into clean, actionable input.
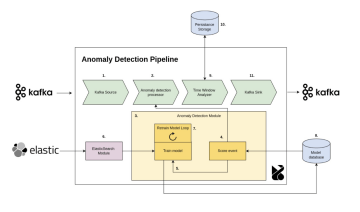
Next comes anomaly detection using a machine learning approach designed for telecom environments. Each radio cell has its own model. These models learn the normal behavior patterns for each cell, including expected fluctuations throughout different times of day, weekends versus weekdays, and special events or holidays.
As new data arrives, BitSwan evaluates it in real time, scoring each event based on how closely it matches past behavior. If the behaviour is not standard it marks the anomaly with optional possibility to send an alert also. This approach ensures timely and meaningful insights by filtering out brief glitches and focusing only on important issues.
Feedback-Driven Intelligence
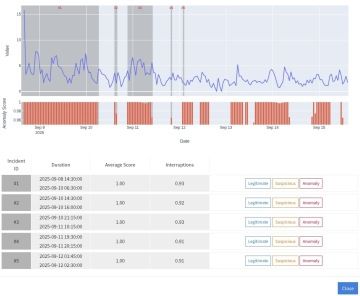
One of BitSwan’s advantages is its interactive feedback loop. Engineers can access a dedicated dashboard to explore anomalies, compare current behavior to historical patterns, and label events based on their insights.
Feedback from engineers is stored and can be used to improve future model training. This creates a cycle of continuous improvement, where the system becomes more accurate with each use. Over time, it gets better at distinguishing false alarms from real problems, reducing noise and increasing trust in its results.
Visualization and Alerting
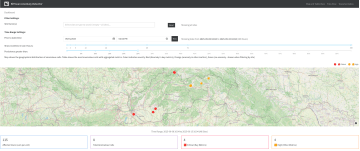
The results from BitSwan’s anomaly detection are centralized in Kafka, which allows for parallel processing. Alerts can be sent via several channels, including email, Slack, SMS, or ticketing systems. Anomalies are saved for historical data exploration using ElasticSearch. A custom dashboard built in Plotly Dash provides visual representation.
The dashboard also helps engineers explore connections across metrics and locations. For instance, when one site experiences increased load while a neighboring cell declines, the system highlights this relationship, aiding engineers in diagnosing cascading failures.

This dashboard also includes a heatmap that shows persistent anomalies by region or cell. It allows time series comparisons between normal and unusual behavior. Users can also perform correlation analysis to find root causes. Experts can provide feedback directly in the dashboard interface, which helps refine the model.
Real-World Impact
A notable case occurred on August 25th, when one base station completely failed while a nearby cell doubled its throughput to make up for it.
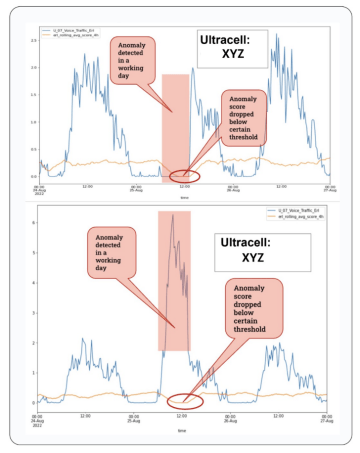
Vizualisation shows a sharp drop in the anomaly score for the first base station and a simultaneous shift in the second. This clearly showcased the cascading effects of the failure.
This proactive incident detection enables Cetin to:
Identify problems before customers notice them.
Engineers focus on high-value incidents.
Alerts are smarter, fewer, and more actionable.
Correlation and root cause analysis are quicker and more efficient.
Building the Future of Operations
Cetin’s embrace of BitSwan is already yielding results, but this is just the start. With a solid foundation in place, the aim is for an even more autonomous and intelligent operations model.
BitSwan’s infrastructure supports creating a digital twin, a virtual model of the network that reflects its real-time state. By simulating potential changes, this provider can forecast the impact of planned upgrades or adjustments without risking live performance. This leads to smarter planning and faster decision-making.
Artificial intelligence will also play a larger role. Insights from anomaly detection are being shared with radio planning and optimization teams. With enough feedback, BitSwan can suggest not just where issues occur but how to prevent them, moving toward a network that continuously improves itself.
Cetin is also looking into automating first-level support. By integrating anomaly detection with chatbots or voicebots, users could be proactively informed about issues, guided to quick fixes, or provided with estimated resolution times—without needing to contact support.
Ultimately, the goal is to create a Self-Organizing Network (SON). BitSwan’s automation features, combined with real-time data and digital modeling, offer a path toward a telecom infrastructure that not only spots issues but also adapts, self-corrects, and evolves.
Cetin’s success with BitSwan shows how real-time data, machine learning, and smart automation can change telecom operations. If you want to see how BitSwan can add similar benefits to your network, whether that means quicker incident response, better alerts, or forward-thinking planning, we would be glad to share more details. Contact us through our website to set up a live demo and learn how BitSwan can help you shift from fixing problems as they happen to predicting and optimizing operations.

